This text will be replaced
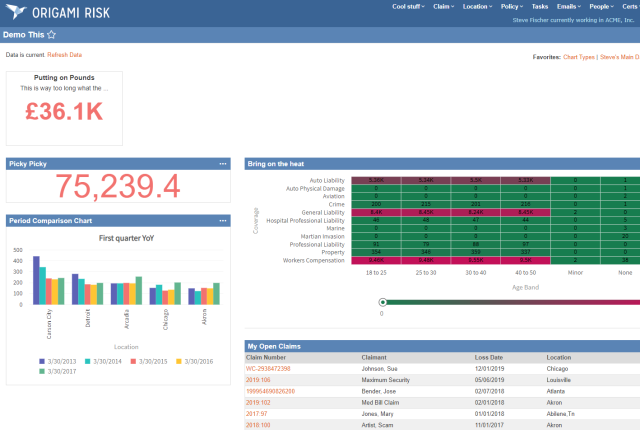
Dashboard Widgets: Frequency Impact
This video describes the Frequency Impact widget, which visualizes the impact of a completed finding at a specific location.
Related Videos
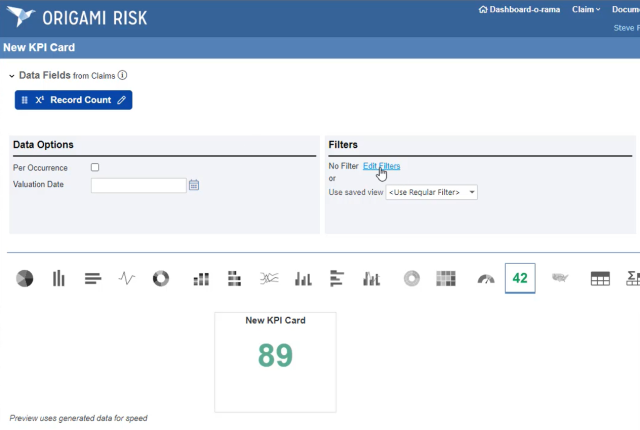
 Add Widget to Dashboard
This video shows how to add an existing widget to a dashboard (July 2021 Release)
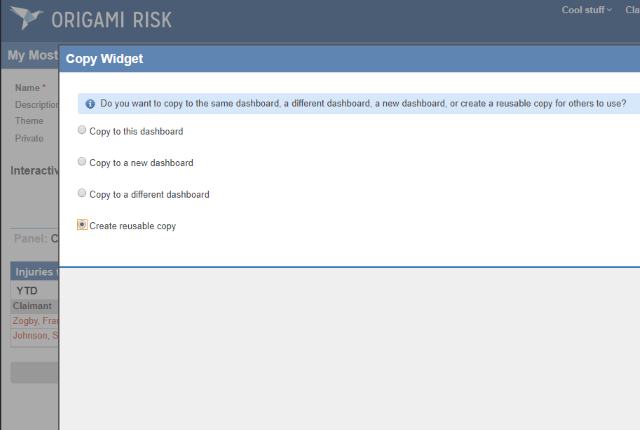 Reusable Custom Widgets
This video shows how to take a custom widgets made with the new widget builder and create a reusable copy for others to use. (November 2019 Release)
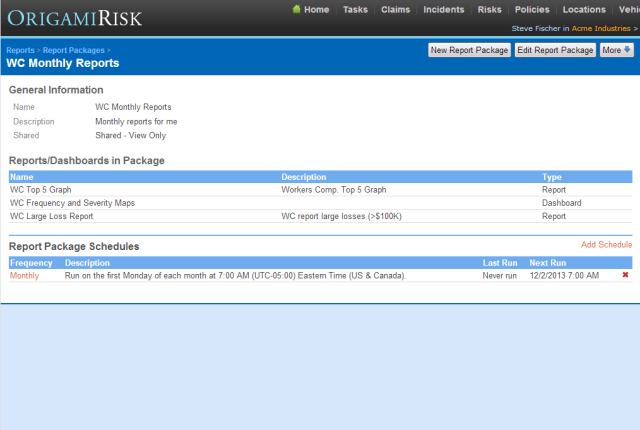 Report Packages
This video explains how to create report packages. A report package is a combination of reports and dashboards packaged together in a single scheduled PDF.
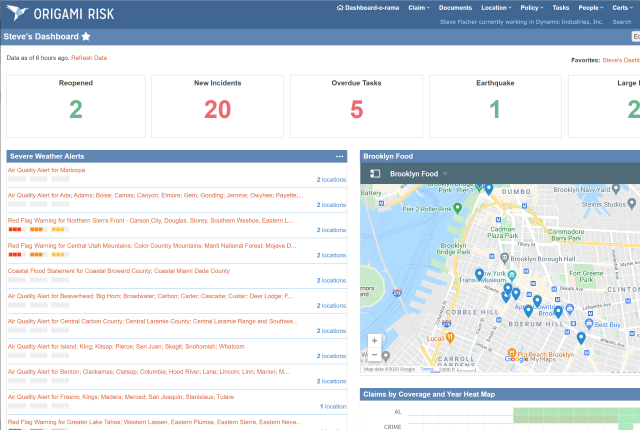
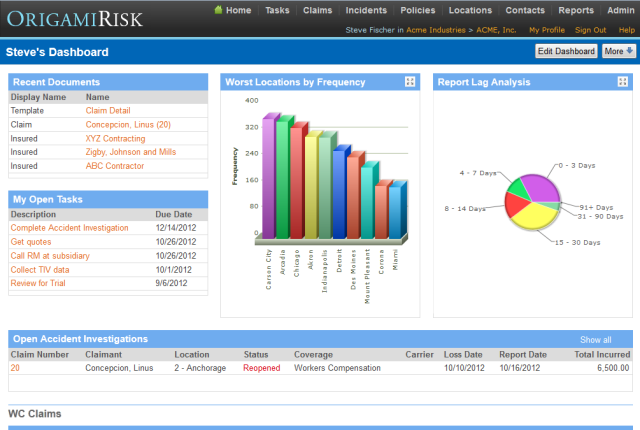 New Dashboards
This tutorial describes the revamped Origami dashboards, highlighting multiple dashboards, sharing, printing and email
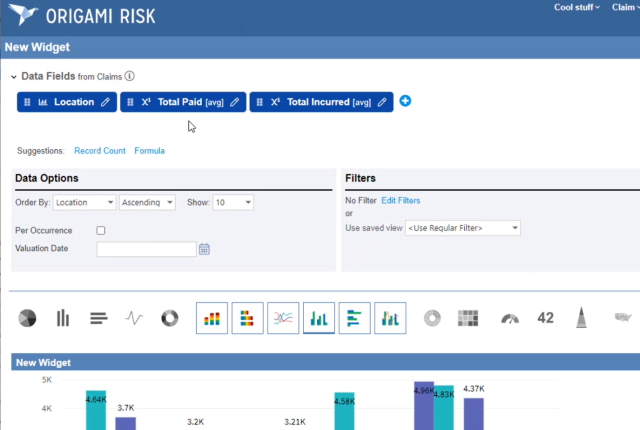 Custom Chart Widgets with Multiple Measures
This video shows how to create custom multi-measure chart widgets for your dashboard (July 2021 Release)
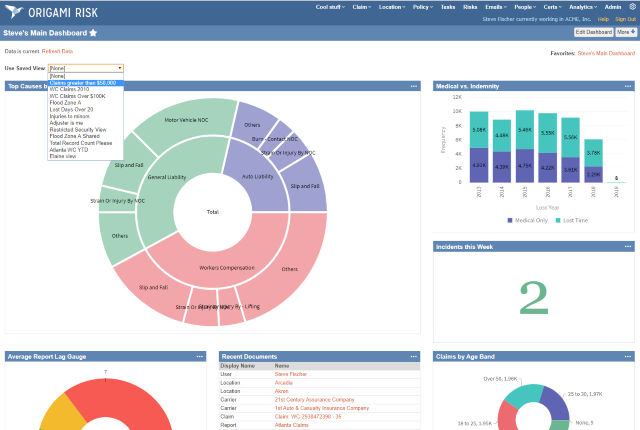 Interactive Options by Domain for Dashboards
This tutorial shows how to add interactive options based on a domain to dashboards for interactive filters using saved views. (November 2019 Release)