This text will be replaced
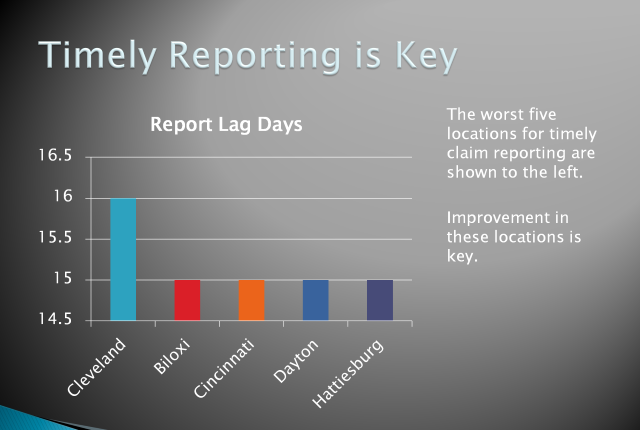
Lag and Loss Levels in Reports
This video describes how to use different levels of Report Lag, Close Lag or Total Incurred for analysis in reports.
Related Videos
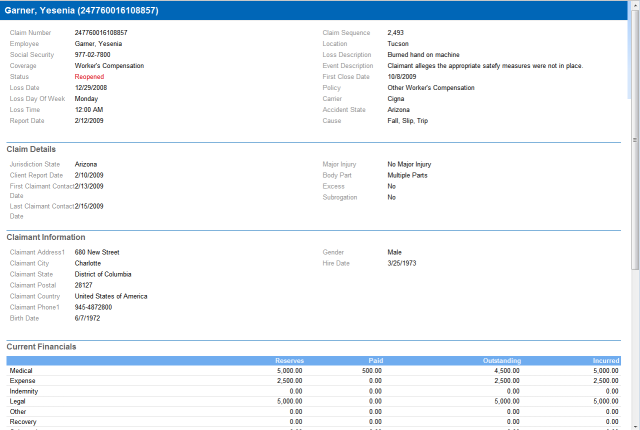 Claim, Location and Policy Abstracts
This video shows how to print a Claim, Location or Policy Abstract including bulk printing of multiple abstracts.
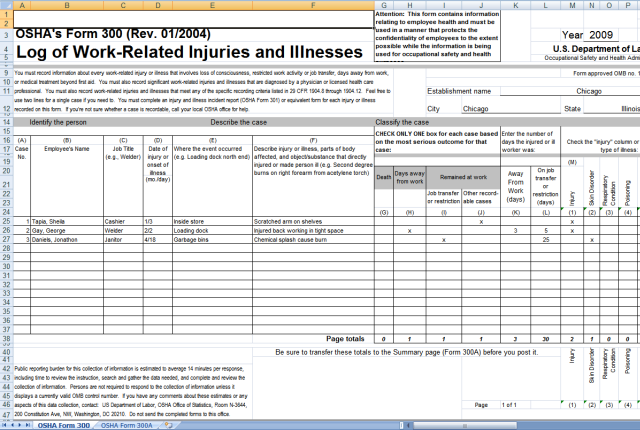 Generating OSHA Logs
This video shows how to generate and schedule the OSHA 300 and 300a logs in Excel format.
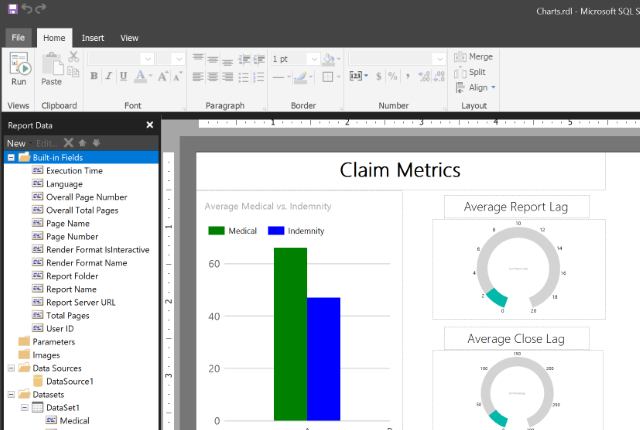
 PowerPoint Presentation Templates
This video explains how to create PowerPoint Presentation Templates. This lets you automate PowerPoint presentations including charts and tables with Origami Data
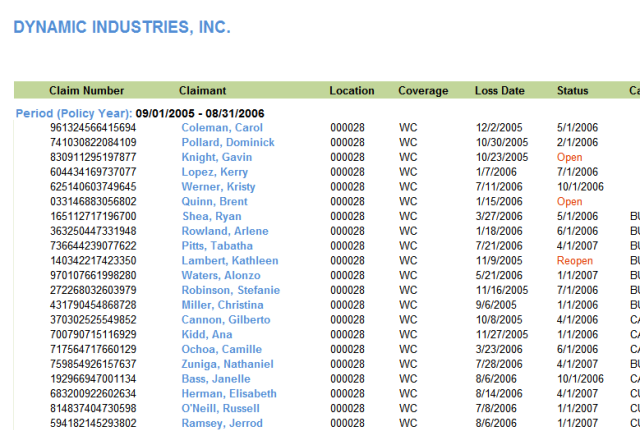
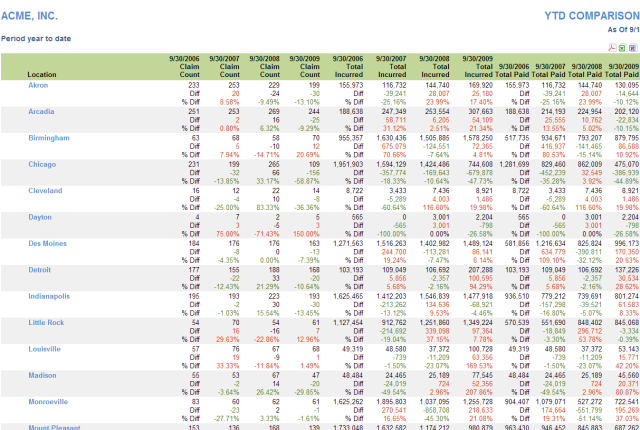 Prior Period Comparison Report
This video provides an overview of the Prior Period Comparison report, which can do apples to apples comparisons of various prior periods.
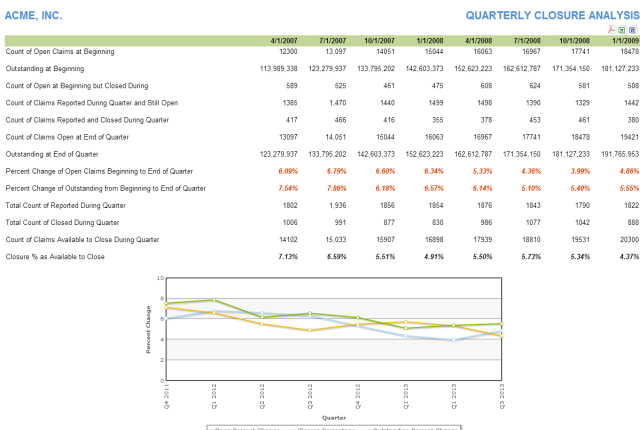 Quarterly Closure Analysis Report
This video provides an overview of the Quarterly Closure Analysis report, which details claim closure rates over the past eight quarters.
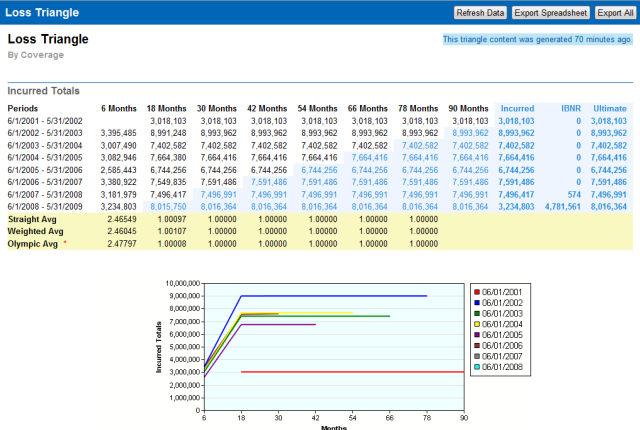 How to Create Loss Triangles
Loss Triangles are powerful actuarial reports that can give you insight on your ultimate costs. This tutorial will cover the basics of loss triangle reporting.