Origami Risk TV - All Videos

 The Claim Comparison Report
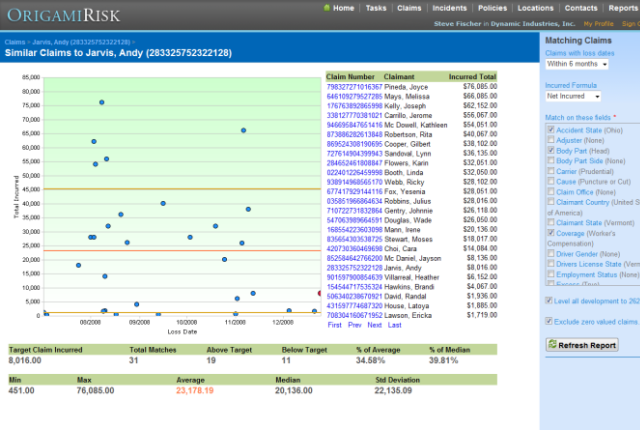
The claim comparison report compares a single claim to similar claims, with results in a scatter graph. This tutorial will go over that report in detail.
 The Claim Summary with Graph Template
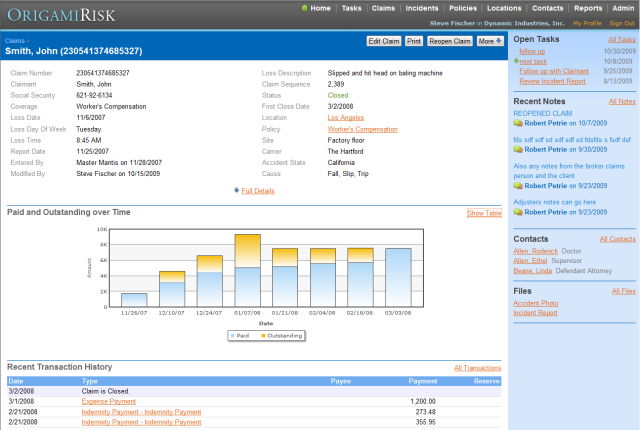
This video describes the Claims Summary with Graph template, a combination graph and claim summary report.
 The Data Update Process
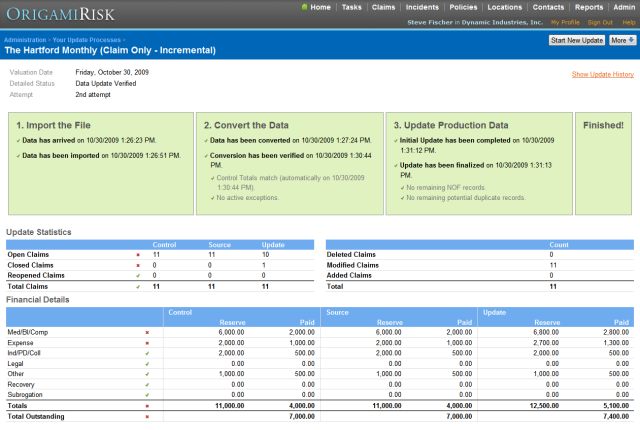
This video gives an overview of the data update process, from code mappings to exception handling.
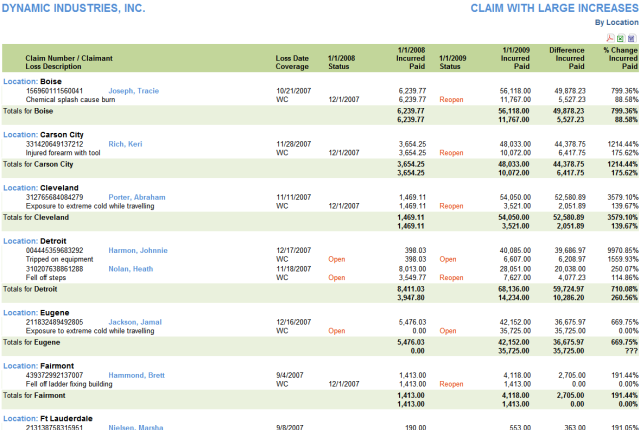 The Financial Comparison Over Time Template
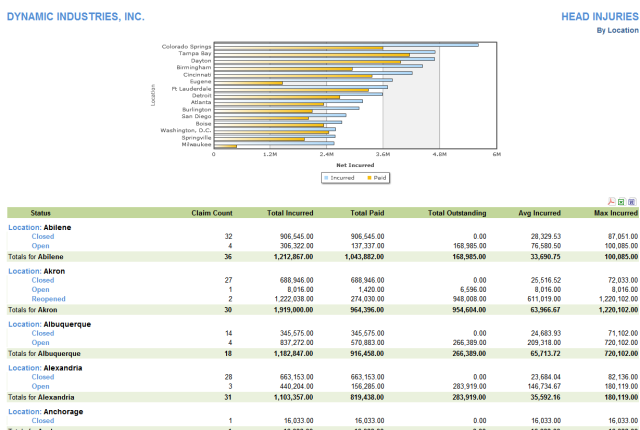
This video describes the Financial Comparison Over Time template, a report that compares claims as of two different points in time.
 Tracking Changes
This video gives an overview of how Origami tracks changes to data, showing the ability to track who changed what field, from what to what and when.
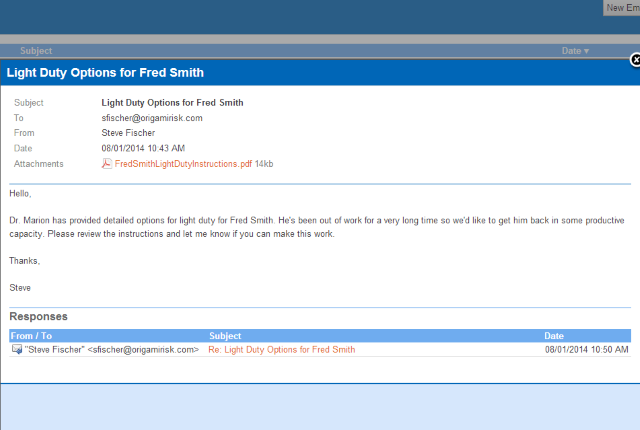 Tracking Emails sent to and from Origami
This video shows how to send emails from Origami and how Origami tracks replies and keeps all correspondence associated with a claim.
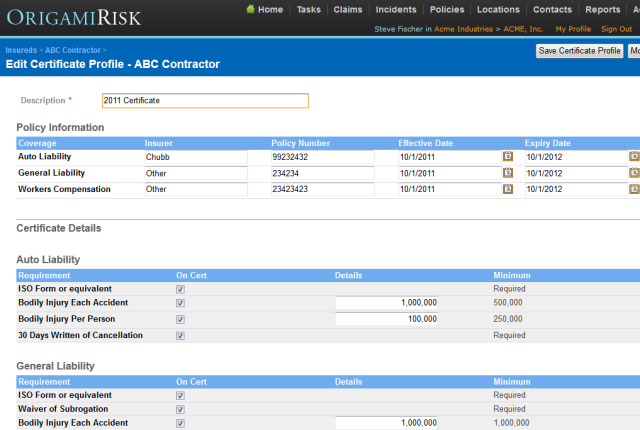 Tracking Insurance Certificates
This video shows how Origami can simplify the process of tracking incoming insurance certificates
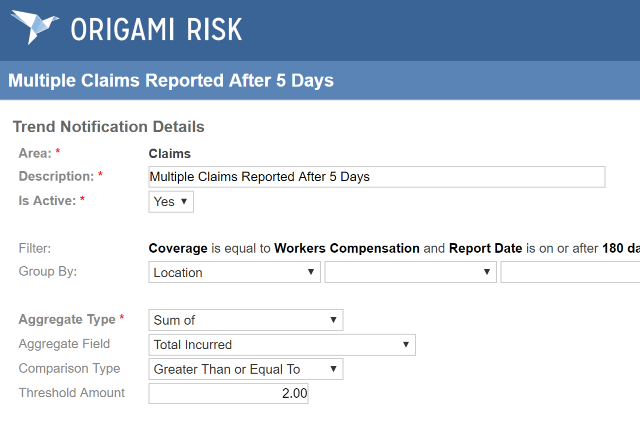 Trend Notifications
This video shows how to define data trends and create custom notification when certain thresholds are reached.
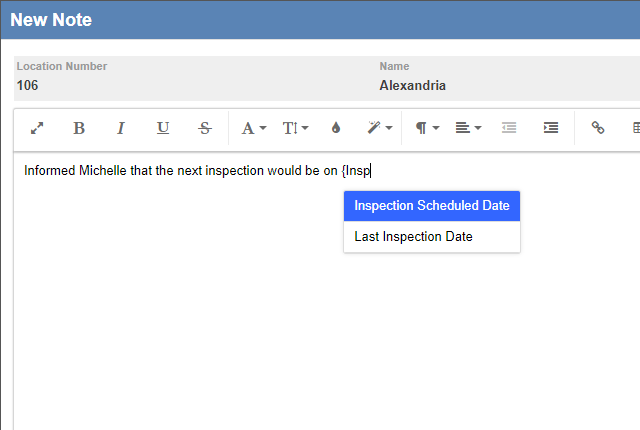 Type Ahead Tags in Emails and Notes
This video shows how to use type ahead tags to populate data into emails and notes.
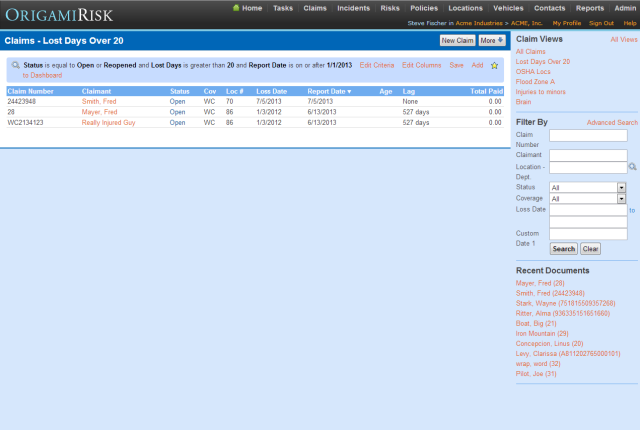 Using Saved Views in Reports and Dashboards
This video explains how to use saved views in reports and dashboards.
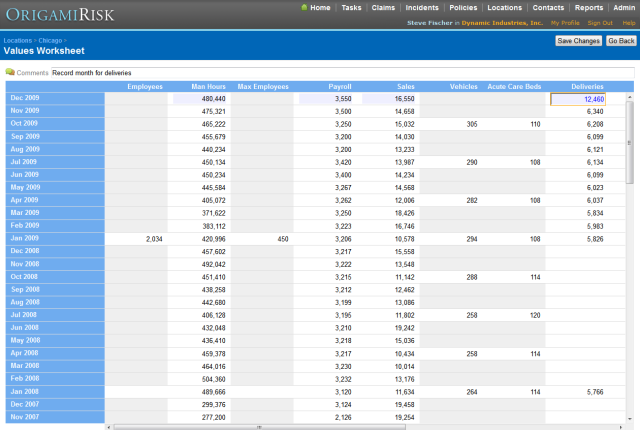 Using the Values Worksheet
This video shows how to use the Values Worksheet to enter exposure values across locations.