Origami Risk TV - Videos On Reports

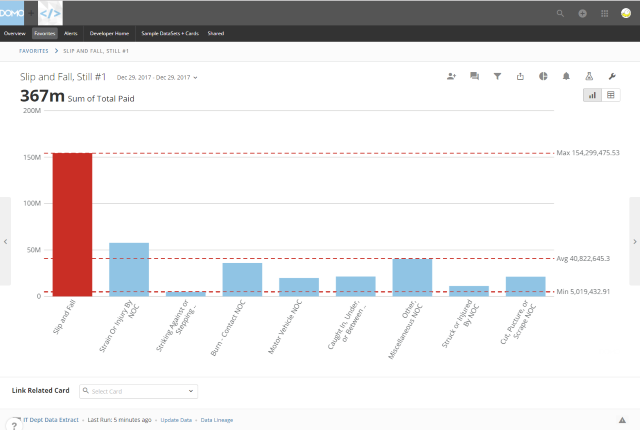 Publishing Origami data to Domo
This video describes how to publish data to Domo to create powerful visualizations.
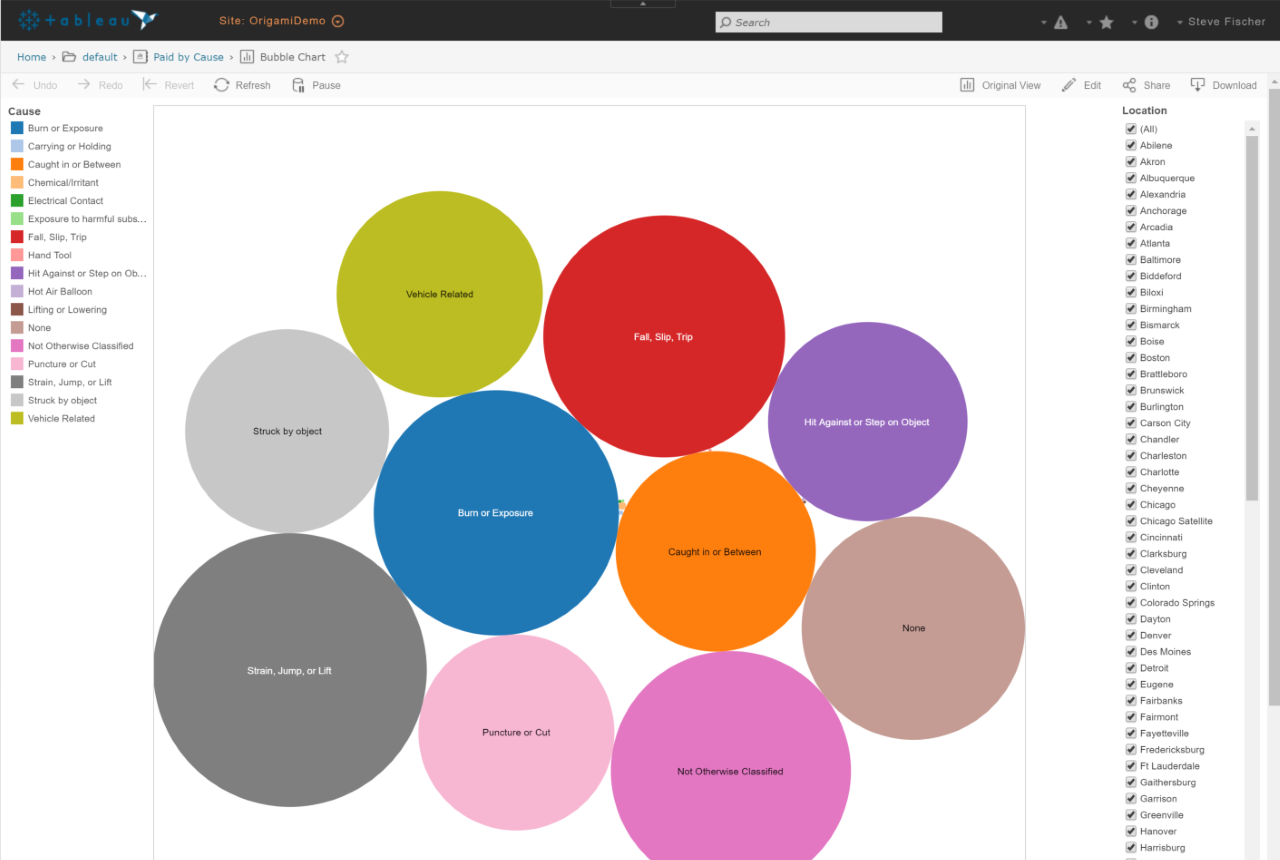 Publishing Origami data to Tableau
This video describes how to publish data to Tableau to create powerful visualizations.
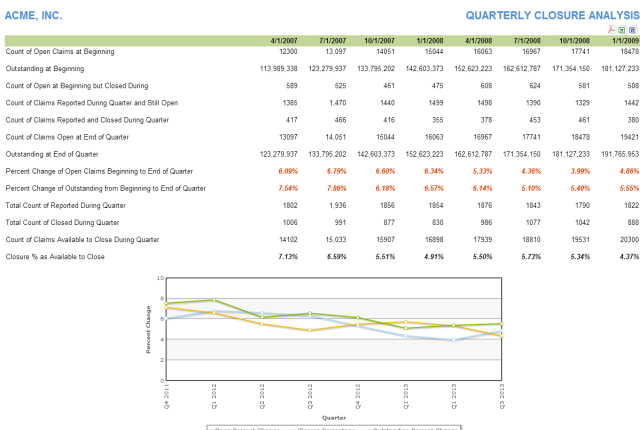 Quarterly Closure Analysis Report
This video provides an overview of the Quarterly Closure Analysis report, which details claim closure rates over the past eight quarters.
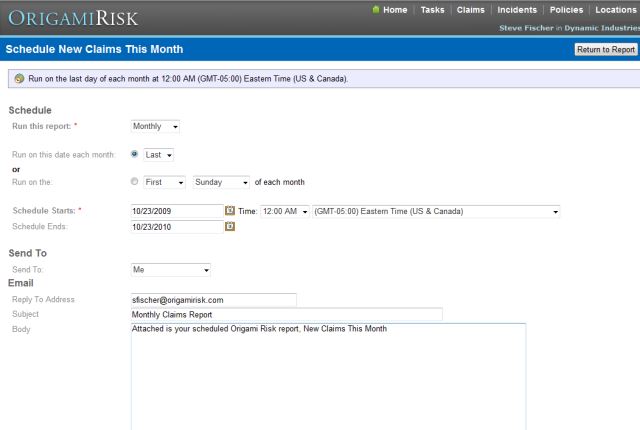
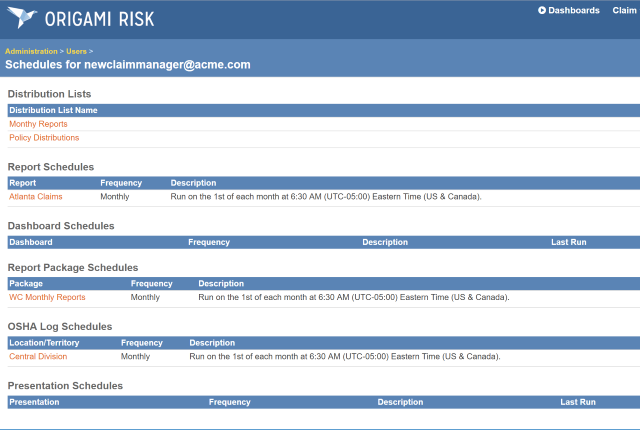 Replacing Users in Schedules
This video shows how to remove or replace a user from report, dashboard, report package and OSHA schedules
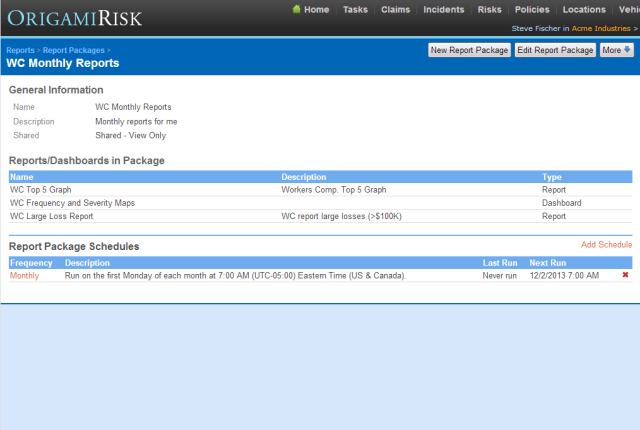 Report Packages
This video explains how to create report packages. A report package is a combination of reports and dashboards packaged together in a single scheduled PDF.
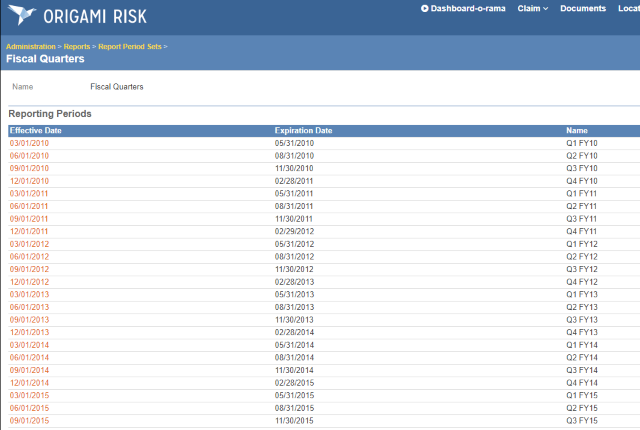 Report Periods - Custom Date Groupings for any Date Field
This video shows how to create custom date periods that can be used for grouping on any date field in reports and dashboards.
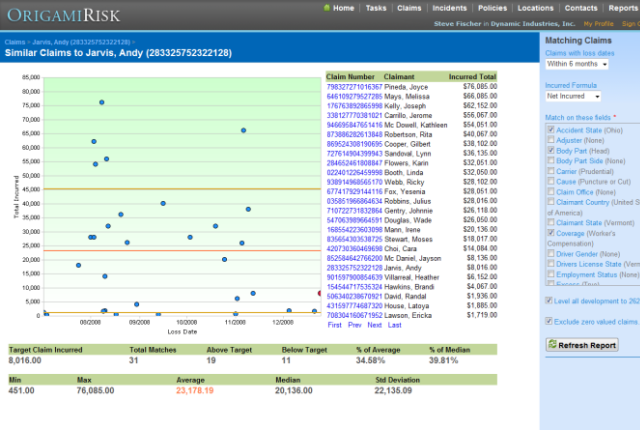 The Claim Comparison Report
The claim comparison report compares a single claim to similar claims, with results in a scatter graph. This tutorial will go over that report in detail.
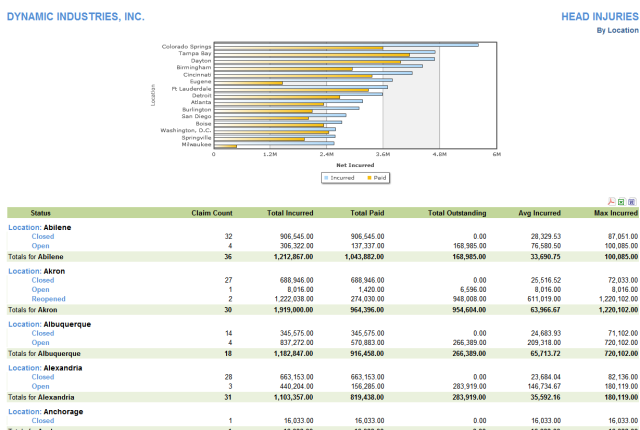 The Claim Summary with Graph Template
This video describes the Claims Summary with Graph template, a combination graph and claim summary report.
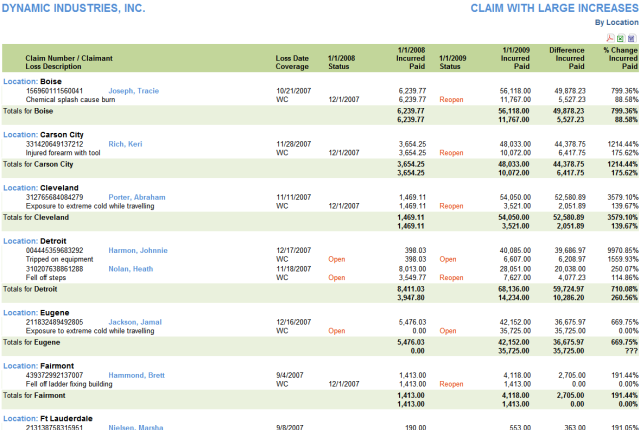 The Financial Comparison Over Time Template
This video describes the Financial Comparison Over Time template, a report that compares claims as of two different points in time.
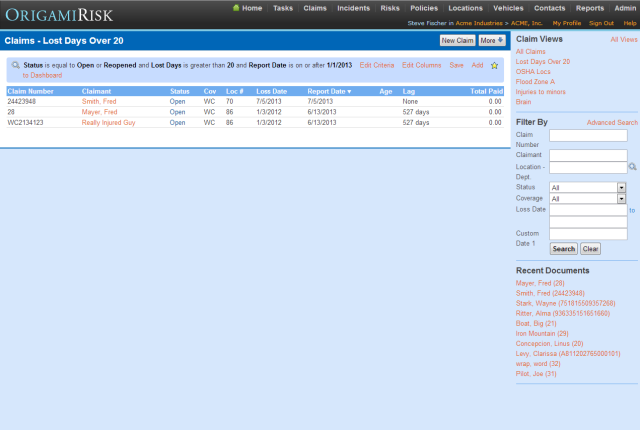 Using Saved Views in Reports and Dashboards
This video explains how to use saved views in reports and dashboards.