Origami Risk TV - All Videos

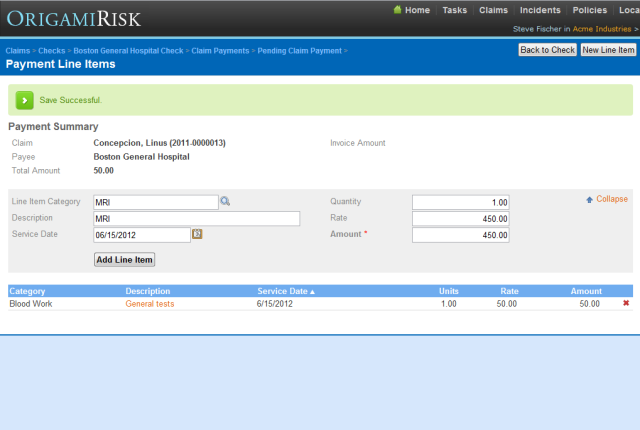
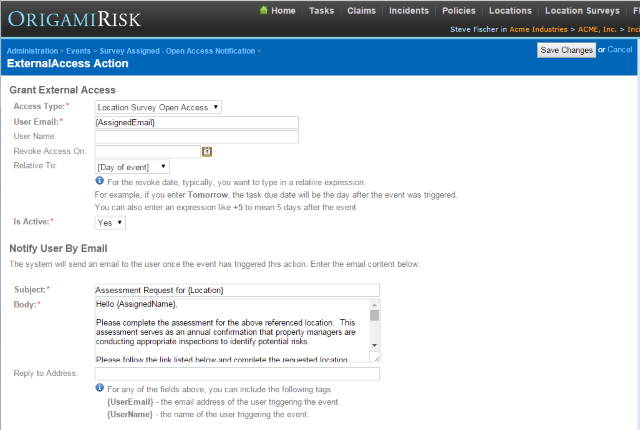 Improving Data Collection with Open Access
This video shows how to create custom events that generate open access links, allowing risk data collection across the organization.
 Integrated ODG Guidelines
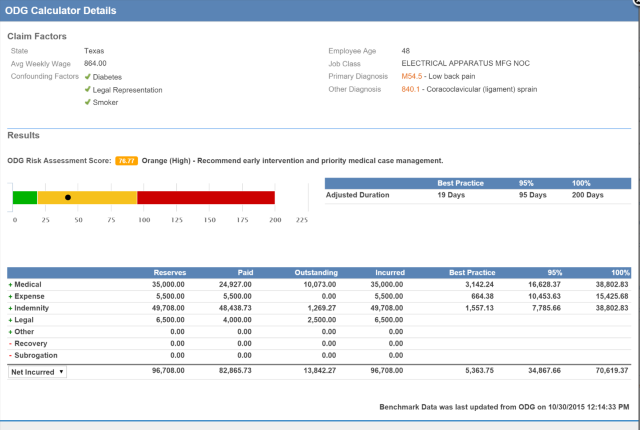
This video shows how Origami integrates with ODG Guidelines to provide key return to work metrics to improve outcomes.
 Integrating GIS Maps
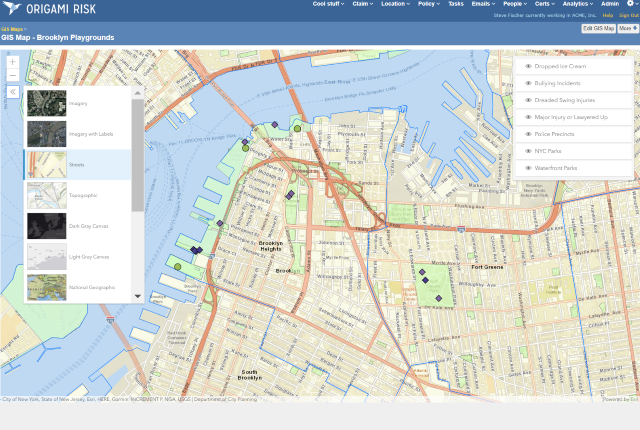
This tutorial goes over the concept of a GIS (Geographical Information System) Map and how to integrate them into Origami with Origami data layers.
 Integrating Origami and Google (OAuth)
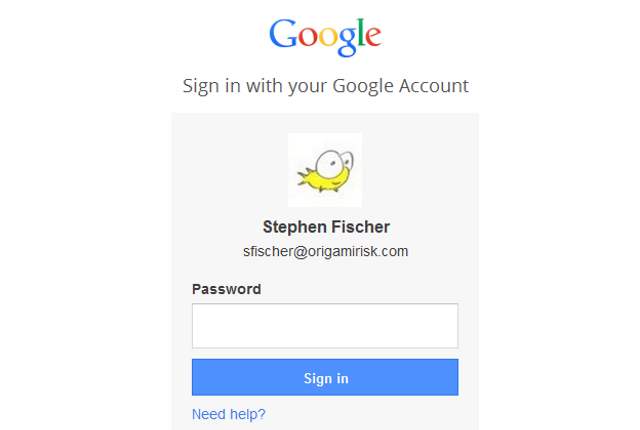
This video explains how you can use your Google account, via the OAuth standard, to log into Origami.
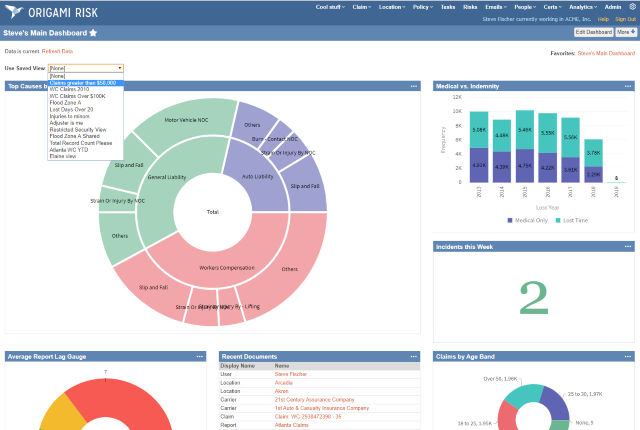 Interactive Options by Domain for Dashboards
This tutorial shows how to add interactive options based on a domain to dashboards for interactive filters using saved views. (November 2019 Release)
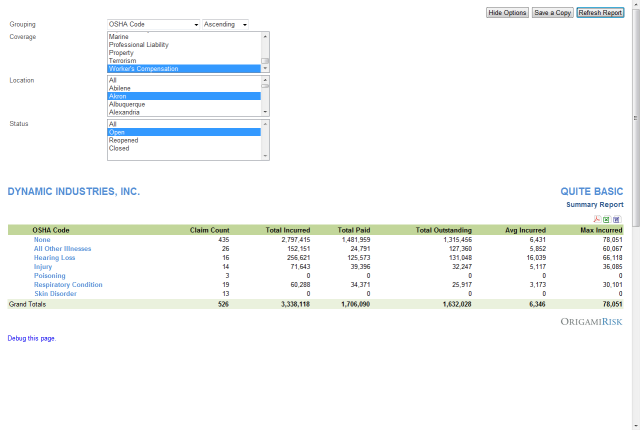 Interactive Options in Reports
This tutorial shows how to add interactive options to reports for added power and on the fly analysis.
 Introduction to Origami Risk
This video provides an introduction to the capabilities of Origami Risk
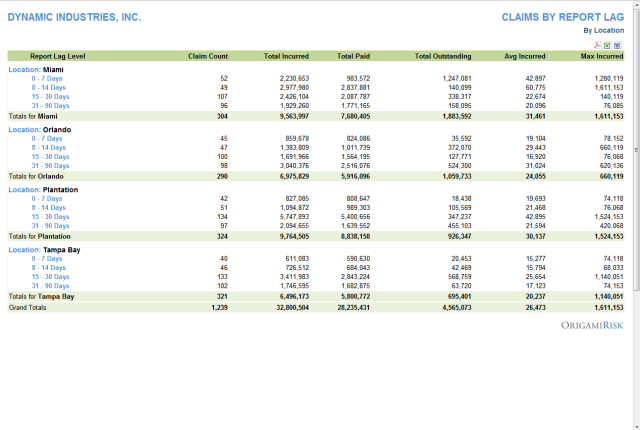 Lag and Loss Levels in Reports
This video describes how to use different levels of Report Lag, Close Lag or Total Incurred for analysis in reports.
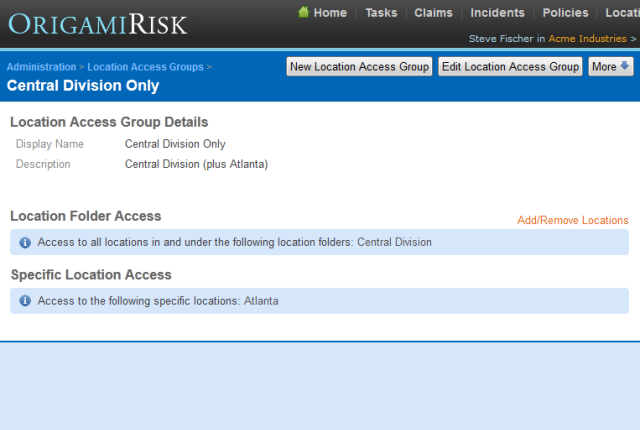 Location Based Security
This video shows how to set up security by location or location folder, restricting certain users to certain locations.
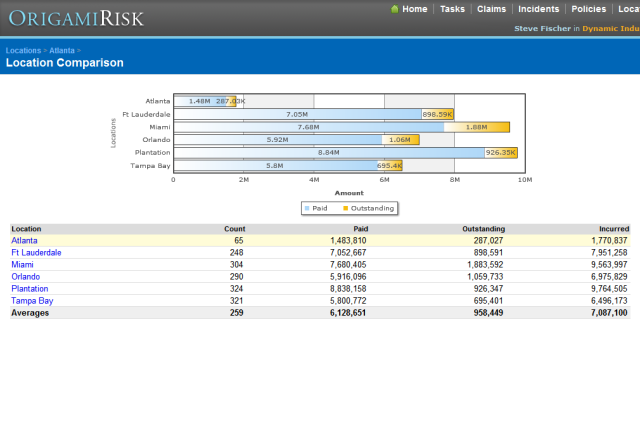 Location Comparison Reports
This video shows location comparison reports from within the location page.
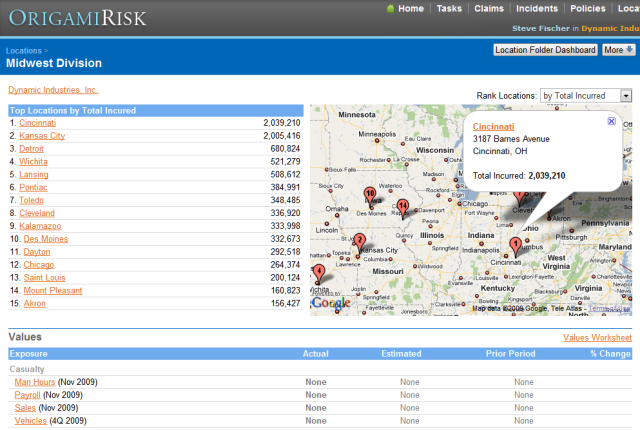 Location Folders
This video explains location folders and shows how Origami provides key analytics at the folder level.